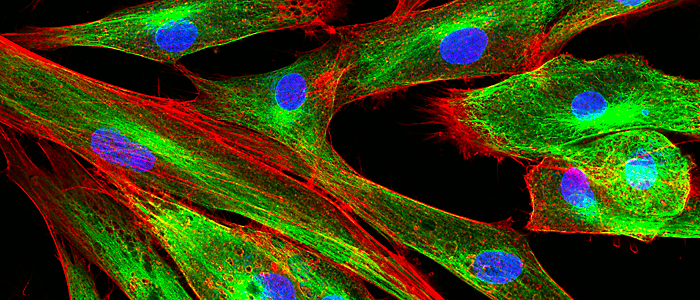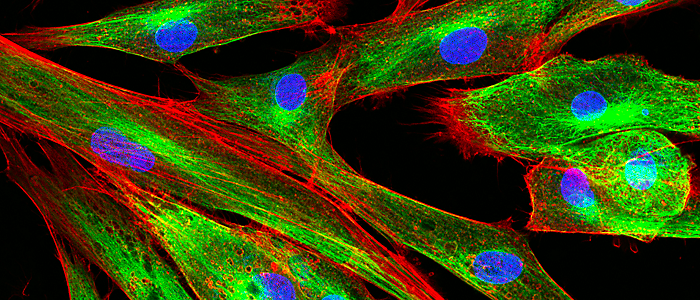
Cell imaging is a powerful tool that’s helping scientists form a clearer picture of the dynamic processes occurring within living cells in real-time. We’ve recently witnessed a number of significant advances in microscopy and fluorescent marker agents take to the stage, so we thought we'd zoom in on the latest developments in imaging that are bringing into focus extraordinary insight into cell biology.
Infrared microscope images live cells in 3D
Infrared (IR) imaging has come a long way in recent years, with the technique now being used for a whole range of applications – from cancer biopsies to revealing the secrets beneath Renaissance artwork. Yet the technique suffers from several limitations that make it unsuitable for studying living systems.
For starters, IR wavelengths are larger than cells themselves – meaning image resolution is insufficient for intracellular imaging. The technique’s lack of depth resolving power and the strong absorption of IR wavelengths by water also make it unsuitable for studying anything other than dried samples.
A team at Perdue University, USA, has overcome these obstacles to map the motion of drugs and lipids in living roundworm cells using an innovative pump-probe IR 3D-imaging technique. The initial ‘pump’ stage involves using an IR laser to excite the molecules within the tissue, causing a local temperature increase that modifies its refractive index. Then, using a visible light beam, the team probed these changes in refractive index to ‘visualise’ the biological material. As the resolution is determined by the visible probe beam, the team were able to produce images 10 times sharper than those obtained by traditional IR imaging.
It’s hoped that the approach will enable the visualisation of individual bacteria without the need for additional labelling molecules. Such an approach could find application in the early detection of infections.
Cellular substructure… now in colour!
Many regard electron microscopy as the ultimate method for cellular imaging. Yet picking out particular proteins from these greyscale images can be difficult. US scientists may have found a solution to this problem, thanks to an innovative labelling technique that shows up selected cellular structures in colour.
Previously, visualisation of specific proteins by electron microscopy required antibodies conjugated to gold particles or quantum dots. However, the poor penetration of these markers into tissue has hampered their more widespread use.
In this new technique, developed by a team at the University of California, San Diego, two photosensitive proteins were encoded into a cell’s genetic material. The cells were grown and stained with cerium complexes containing diaminobenzidine (DAB) monomers, which were sufficiently small to allow diffusion within the cell. When irradiated with a certain wavelength of light, the photosensitive protein released reactive oxygen species causing nearby DAB monomers to dimerise, fixing the metal complexes to the protein.
The cells were then stained with a second DAB complex – this time containing praseodymium. Irradiation with a different wavelength of light, unique to a second photosensitive protein, fixed any nearby praseodymium complexes in place. Electron energy loss spectroscopy was then used to pick out the different lanthanide metals, producing coloured maps that could be overlaid on conventional electron micrographs.
Using the technique, the team probed the inter-membrane interactions of astrocytes (star-shaped nerve cells) to investigate biomolecular behaviour at synapses – electron dense regions that are difficult to study using conventional electron microscopy.
Although the approach requires a number of additional sample preparation steps and a custom built microscope, the team are confident that it can be simplified, and hope to expand the technique to label three component systems in future.
Fluorescent ‘traffic lights’ show cell life cycle in full
A fluorescent marker system developed by US scientists has been used to visualise all of the key phases in cell division, distinguishing between more stages than current reporting systems.
Cells go through four distinct stages between formation and replication: an initial growth phase (G1), a DNA replication stage (S), a second growth stage (G2), and finally mitosis or cell division (M).
Tracking these phases is extremely important when, for example, studying how successful potential anti-cancer treatments are at stopping tumour replication. Yet current fluorescence probes, such as the widely used two-colour FUCCI reporter system, are unable to distinguish between the S, G2 and M phases – meaning precise determination requires killing the cell. A key challenge has been to develop a unique combination of markers with wavelengths specific to a particular stage in the cycle, and linking these to cellular proteins that change over a cell’s lifetime.
To address this, the Stanford University team developed a new red fluorescent marker to identify cell mitosis. By modifying the protein’s pi-pi stacking through multisite mutagenesis, the team shifted its fluorophore emission spectrum even further into the red to make it more easily distinguished from other marker wavelengths. By also linking a blue fluorescent marker to a protein that is degraded immediately after the S phase, the team created a set of four orthogonal fluorescent indicators that produce a unique combination of wavelengths depending on life cycle stage.
It’s hoped that the new system, named FUCCI4, will enable more finely tuned analysis of how genetic changes and external stimuli affect the cell cycle, particularly in the study of cancer.
Imaging isn’t everything. Keep up to date with the latest developments in tissue mapping and beyond
New developments in life science continue to drive progress in a wide range of fields, from imaging and diagnostics, through to nanorobotics and medical devices. Subscribe to our newsletter to stay on top of latest trends and awesome discoveries.
Image: Vshivkov/Shutterstock.com


